Labour costs in Australia

Labour costs according to spending
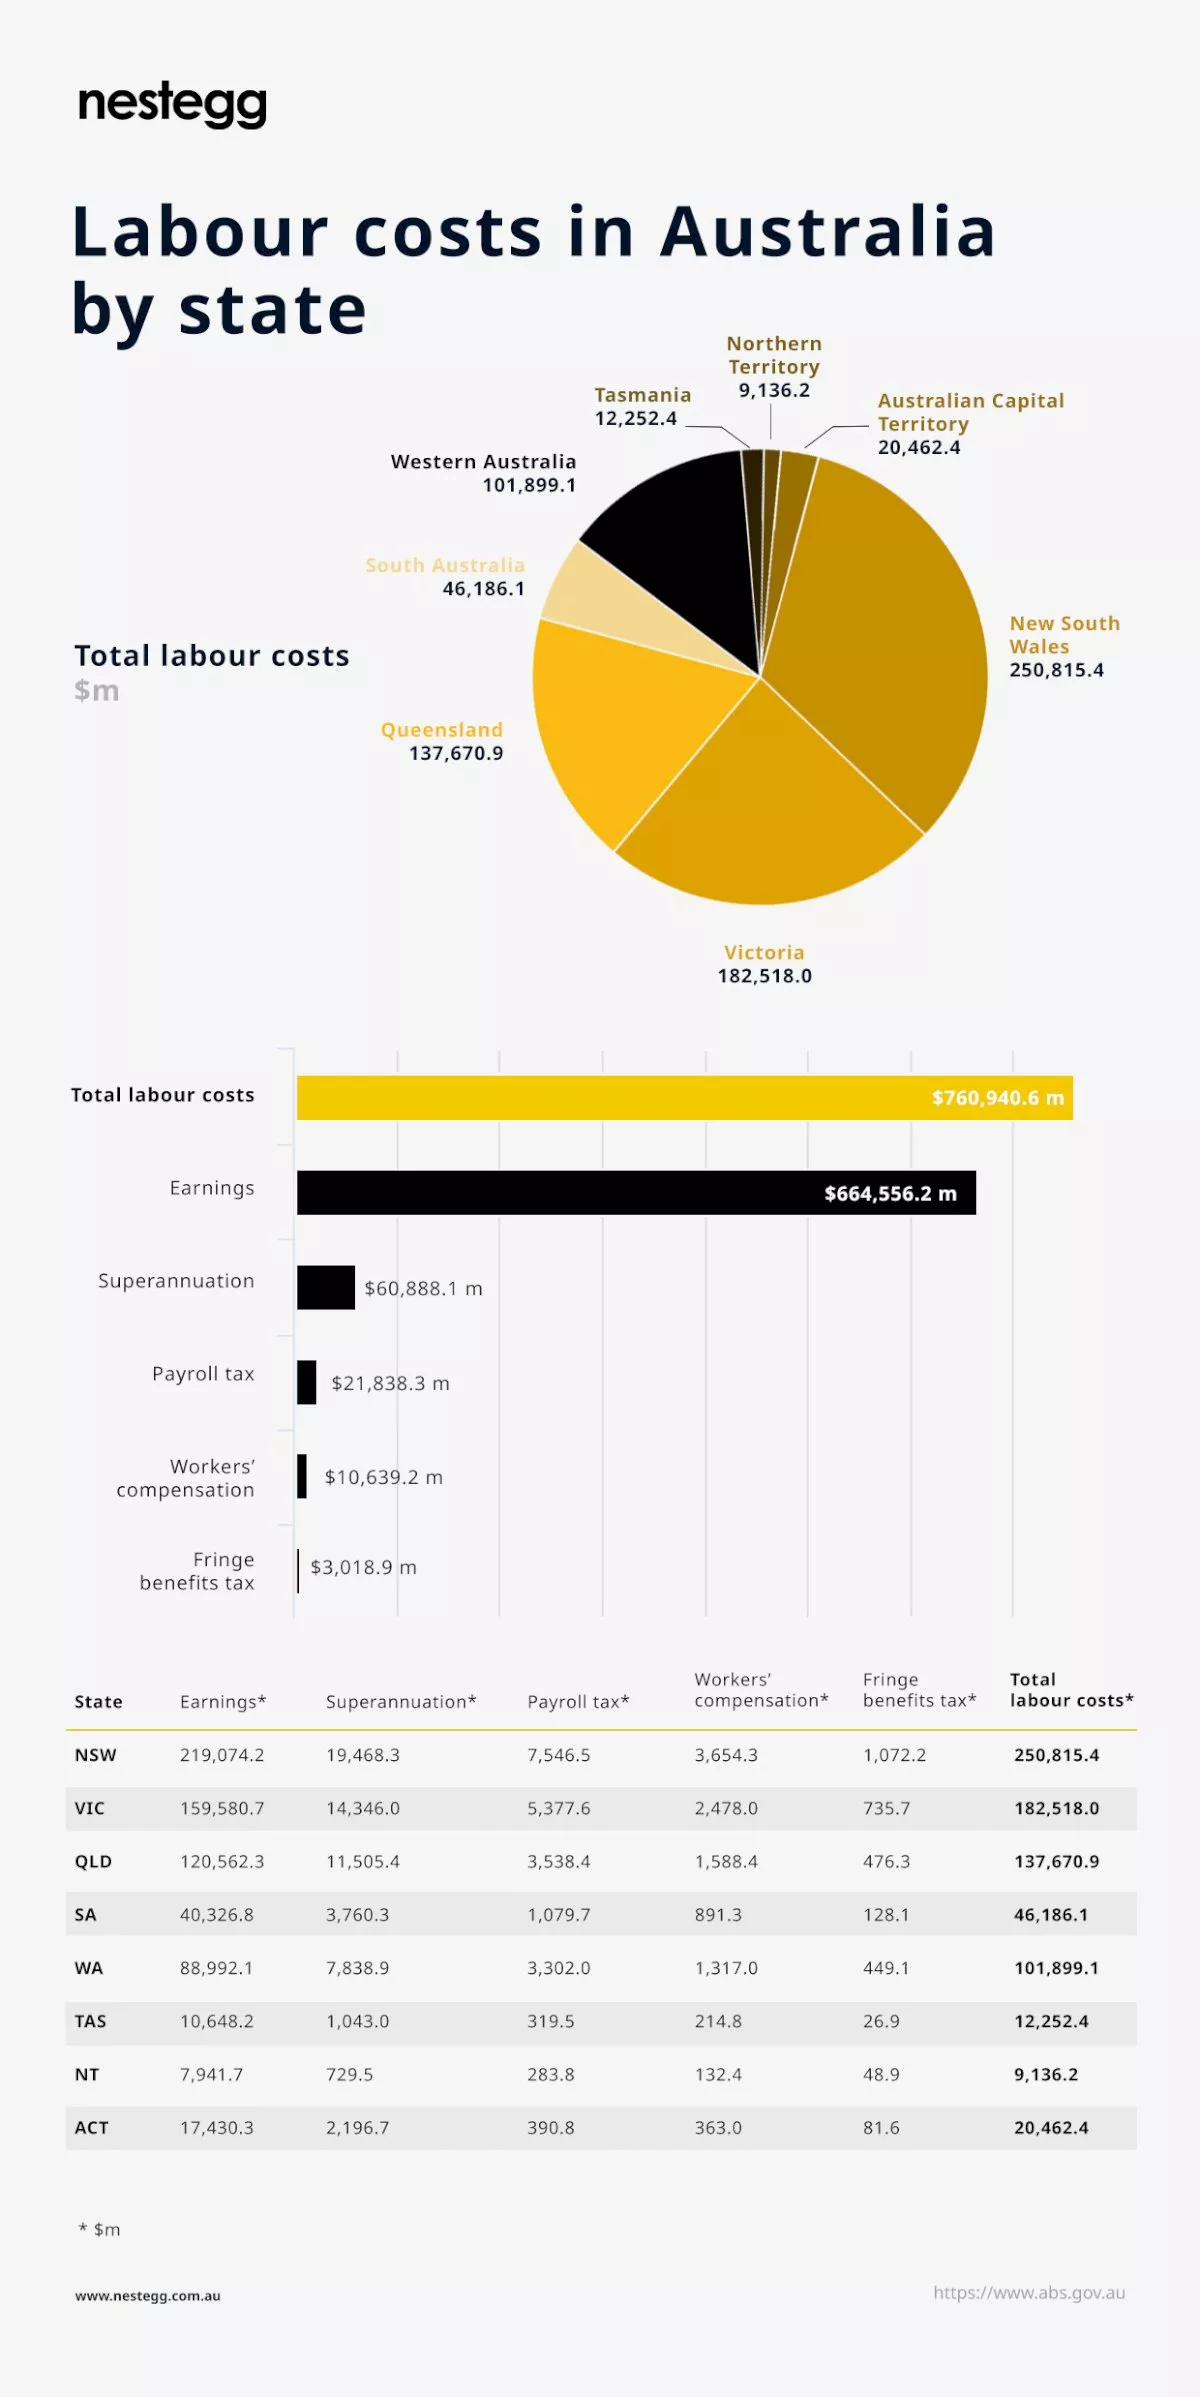
The survey covering financial year 2015-16 showed that out of the $760.9 billion employer spending, $664.6 billion (87.3 per cent) were expedited as employee earnings – the biggest labour cost overall.
Superannuation contributions accounted for the second largest labour cost at $60.9 billion (8.0 per cent) followed by payroll tax at $21.8 billion (2.87 per cent).
The private sector accounted for the larger share of labor costs among all employers – with $591.4 billion (77.7 per cent) of total labour costs coming from private sector employers.
On the other hand, $168.6 billion (22.3 per cent) of labour costs came from the public sector employers.
Labour costs by state
Total labour cost in NSW ranked the highest among Australian states and territories – with NSW accounting for $250.8 billion.
NSW’s earnings and superannuation costs were recorded at $219.1 billion and $19.5 billion, respectively.
Victoria’s labour cost ranked second at $182.5 billion – with $159.6 billion accounting for its employee earnings and $14.34 billion for superannuation.
Ranking third on the list, Queensland recorded a total of $137.7 billion – with earnings and superannuation accounting for $120.6 billion and $11.5 billion, respectively.
The Northern Territories recorded the lowest total labour cost overall at $9.1 billion, of which $7.9 billion went towards employee earnings, while $729.5 million was the total cost for super.
About the author

About the author


Cracking the facts
Investment property or stocks?
Should you invest in stocks or investment property to build your wealth? In this video, we explore both options and see which one can help you better achieve your financial goals. ...Read more

Cracking the facts
What is a financial adviser?
If you’re struggling with managing your money, planning your retirement or looking to build your wealth with the proper investment strategy, you may be in need of solid financial advice from an expe...Read more

Cracking the facts
What does the job sector look like in Australia?
[INFOGRAPHIC] The Australian job sector saw a boost in FY 2016-17, with the majority of regions reporting an increase in jobs compared with the previous financial year. ...Read more

Cracking the facts
Australians’ weekly spending based on life stage
According to ABS data, Australian households spent $1,425 per week*. ...Read more

Cracking the facts
How have people’s lives changed since 2011?
INFOGRAPHIC: The Australian Bureau of Statistics conducts the Census of Population and Housing every five years – with the first to third waves done in 2006, 2011 and 2016, respectively. ...Read more

Cracking the facts
Sector jobs across Australia
INFOGRAPHIC: Recent data from the Australian Bureau of Statistics (ABS) revealed that the number of job vacancies in Australia increased in the February 2019 quarter. ...Read more

Cracking the facts
Where are Australians going on holiday?
INFOGRAPHIC: Australians are among the most well-traveled people in the world, with many of us taking a number of short-term trips each year. ...Read more

Cracking the facts
What is the highest-earning postcode in each state/territory?
[INFOGRAPHIC] The ATO has released the annual Taxation Statistics report for the financial year 2016-17. ...Read more

Cracking the facts
Investment property or stocks?
Should you invest in stocks or investment property to build your wealth? In this video, we explore both options and see which one can help you better achieve your financial goals. ...Read more

Cracking the facts
What is a financial adviser?
If you’re struggling with managing your money, planning your retirement or looking to build your wealth with the proper investment strategy, you may be in need of solid financial advice from an expe...Read more

Cracking the facts
What does the job sector look like in Australia?
[INFOGRAPHIC] The Australian job sector saw a boost in FY 2016-17, with the majority of regions reporting an increase in jobs compared with the previous financial year. ...Read more

Cracking the facts
Australians’ weekly spending based on life stage
According to ABS data, Australian households spent $1,425 per week*. ...Read more

Cracking the facts
How have people’s lives changed since 2011?
INFOGRAPHIC: The Australian Bureau of Statistics conducts the Census of Population and Housing every five years – with the first to third waves done in 2006, 2011 and 2016, respectively. ...Read more

Cracking the facts
Sector jobs across Australia
INFOGRAPHIC: Recent data from the Australian Bureau of Statistics (ABS) revealed that the number of job vacancies in Australia increased in the February 2019 quarter. ...Read more

Cracking the facts
Where are Australians going on holiday?
INFOGRAPHIC: Australians are among the most well-traveled people in the world, with many of us taking a number of short-term trips each year. ...Read more

Cracking the facts
What is the highest-earning postcode in each state/territory?
[INFOGRAPHIC] The ATO has released the annual Taxation Statistics report for the financial year 2016-17. ...Read more


